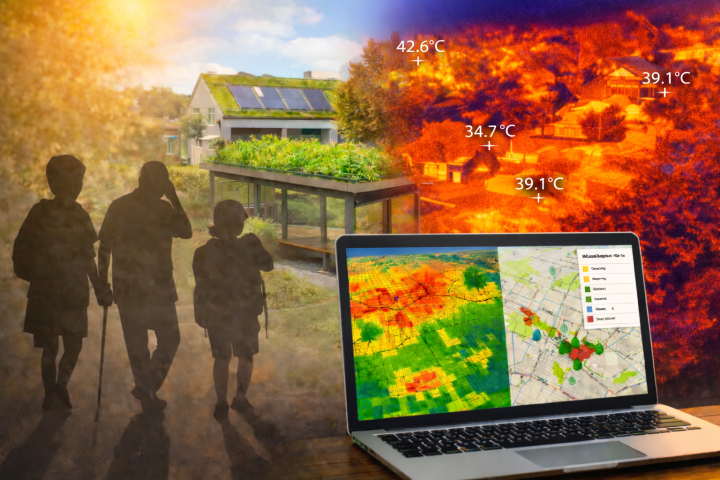
Heat data for the past 10 years now available for the Austrian–Hungarian border region
While some cities have already attempted to assess where heat exposure is greatest based on land surface temperature data from individual days, a publicly accessible database covering an area roughly the size of a country has now been created using 10 years of data. By processing the raw data, several different indices can be explored.
The analysis combined satellite observation data, reanalysis data and a specialised thermal modelling process at 30-metre resolution to provide high-resolution land surface temperature maps and derived heat exposure products for urban and regional climate adaptation planning.
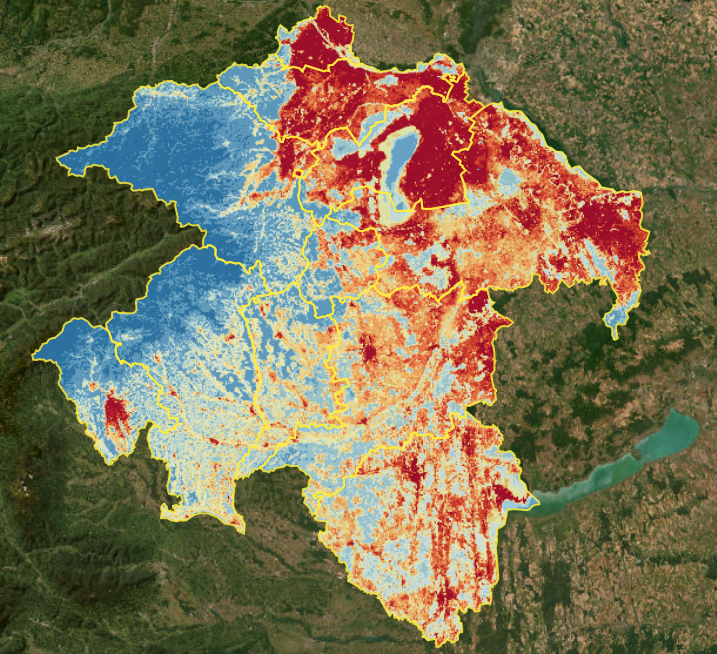
In Hungary, the analysis was carried out for Győr-Moson-Sopron, Zala and Vas counties within the framework of the TopHeAT-HU project. Based on 10 years of summer land surface temperature data, a composite index shows which areas experience the most intense heat exposure (dark red).
Heat exposure in the Austrian–Hungarian border region based on data from the 2016–2025 period (May to September):
The key strength of the visualised data lies in comparison: identifying which surfaces remain consistently warmer or cooler, where stronger heat exposure emerges as a recurring trend over several consecutive summers, and where local differences indicate potential locations for adaptation measures. These may include greening, shading, the use of cooler paving and building materials, or targeted on-site assessments.
Higher-elevation, mountainous, forested and water-covered areas clearly appear in blue on the map, while larger settlements appear in red – which is hardly surprising. However, some other areas are also shown in red, such as the low-density settlement area east of Lake Fertő. This also points to something that similar, higher-resolution urban datasets clearly show: some agricultural areas can also function as “hot spots” or heat stress hotspots.
The web-based map viewer allows users to interactively explore hourly land surface temperature data, daily summaries, urban heat island indicators, heatwave events, the annual number of hot days, and the surface heat exposure index. The latter takes into account excessive daytime heating, limited night-time cooling and the number of hot days on a pixel-by-pixel basis.
The five different views are the following:
-
Hourly: A single day, hour by hour. Hit Play day to watch the heat build and fade.
-
SUHI: The summer average: where a town runs hotter than the countryside around it, by day, by night, and how far it swings between the two.
-
Heatwaves: Multi-day extreme-heat events that actually happened. Click a card to load that event onto the map.
-
Hot Days: How many unusually hot days each spot got in a given year.
-
Heat Index: A combined heat-exposure score, ranked from the coolest tenth of the area to the hottest.
Finding your way around on the platform:
• Jump to a town with Navigate to Region, or switch on Place names under Color & Overlay to label the map itself.
• Click anywhere on the map to drop a probe (up to six) and read its temperature curve in the chart below.
• The Opacity slider fades the heat layer back to reveal the satellite image underneath.
• Not enough contrast? Type your own min and max °C into the colour range boxes to stretch the scale over the values you care about, or press Auto to snap back to the default for that view.
The platform is designed to support both accessible public communication and technical planning work. Non-expert users can explore heat patterns directly through the map interface, while users with GIS expertise can export raster layers and structured data packages for use in their own workflows.
The platform is available at: https://topheat-hu.termatics.com/. This is not yet the final product, but one of the “building blocks” of a broader decision- and planning-support platform that will integrate these results with a catalogue of nature-based solutions.