ENERGIAKLUB
Hungarian
  • Search
  • Close
  • Menu
  • Menu

Main menu

  • Services
    • Research
    • Training
    • Communication
    • Climate and Energy Strategy
    • Consultancy
  • Topics
    • Renewable energy
    • Paks Nuclear Plant
    • Municipalities
    • Buildings
    • Climate and Energy Policy
    • Corruption
    • Energy Performance Certificates
    • Energy poverty
  • Resources
    • Study
    • Brochure
    • Infographics
    • Tutorial
    • Video
    • Photos
    • Podcast
    • Cikk
  • Projects

Second menu

  • News
  • About Us
  • Pressroom

Third menu

  • Facebook
  • Blog
Search
Close

Breadcrumb

  • Home
  • Renewable energy
  • Paks Nuclear Plant
  • Municipalities
  • Buildings
  • Climate and Energy Policy
  • Corruption
  • Energy Performance Certificates
  • Energy poverty
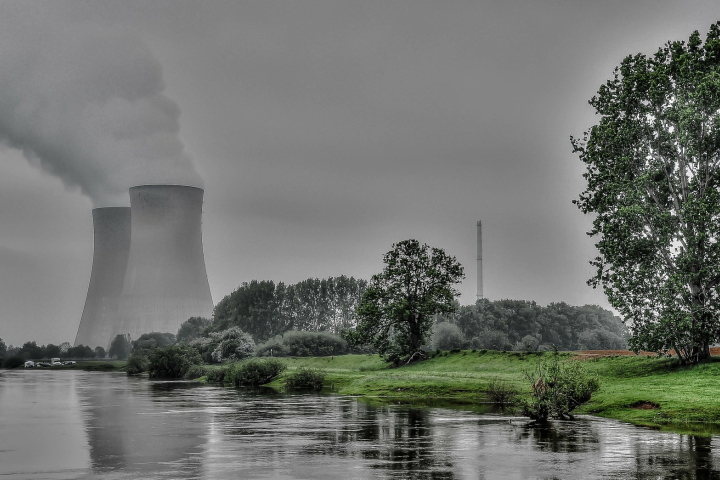
Photo: Pixabay
Infographics

Nuclear energy: too expensive, polluting, weather-dependent and is declining globally

Wed, 07/26/2023 - 12:00

We have published several studies over the past few years on the arguments against nuclear energy: radioactive waste, operational discrepancies or the excessive delays and cost overruns of...
Download
Infographics

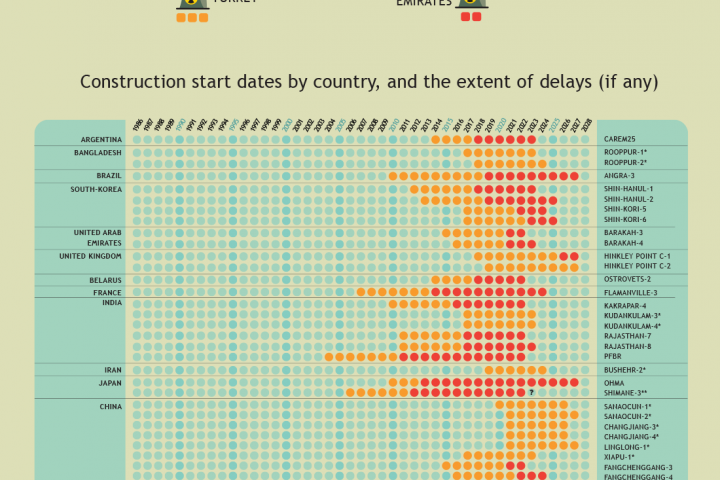
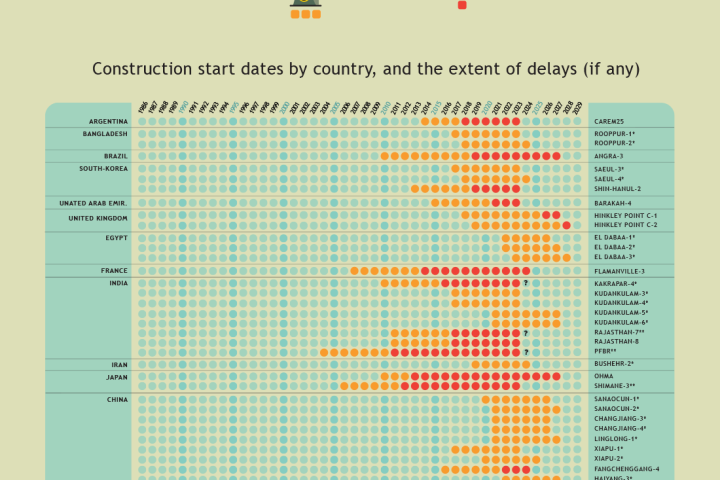
Nuclear power plants under construction - 2023

Mon, 07/17/2023 - 12:00

Based on IAEA data and providing an update on our infographics from 2022, information on reactors currently under construction are presented in the infographics downloadable below.

Download
Infographics

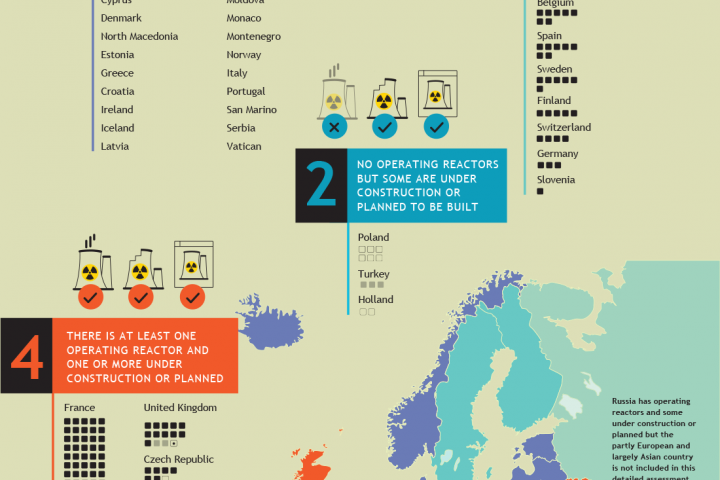
Nuclear power plants in Europe 2022

Thu, 07/28/2022 - 12:00

According to nuclear industry players, nuclear energy should and will play a major role in the future European energy mix. However, our infographic reveals that the majority of European countries do...

Download
Infographics

Nuclear power plants under construction - 2022

Wed, 07/27/2022 - 12:00

Based on our report "Nuclear power plants under construction - 2022", information on reactors currently under construction are presented in an infographic.

Download
Infographics

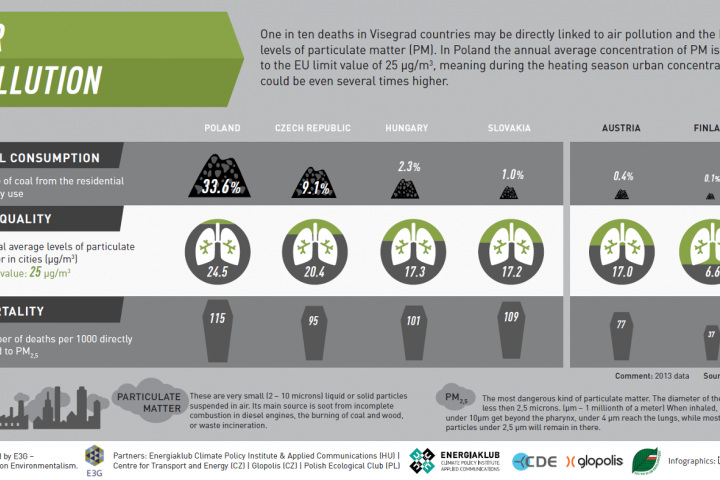
Air Pollution

Mon, 10/17/2016 - 12:00

One in the deaths in Visegrad countries may be directly linked to air pollution and the high levels of particulate matter (PM). In Poland the annual average concentration of PM is close to the EU...

Download
Infographics

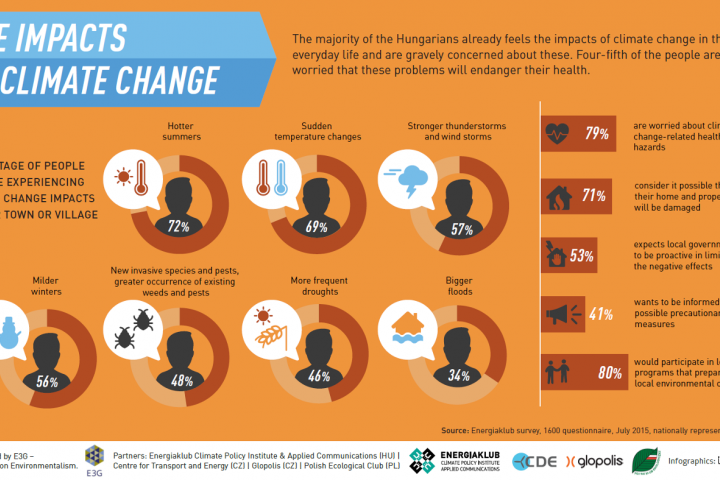
The impacts of climate change

Mon, 10/10/2016 - 12:00

The majority of the Hungarians already feels the impacts of climate change in their everyday life and are gravely concerned about these. Four-fifth of the people are worried that these problems will...

Download
Infographics

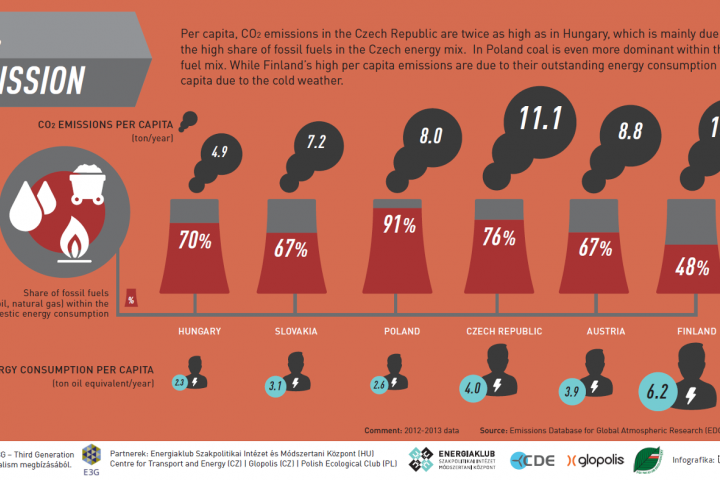
CO2 Emission

Mon, 10/03/2016 - 12:00

Per capita, CO2 emissions in the Czech Republic are twice as high as in Hungary, which is mainly due to the high share of fossil fuels in the Czech energy mix. In Poland coal is even more dominant...

Download
Infographics

Energy intensity

Tue, 05/31/2016 - 12:00

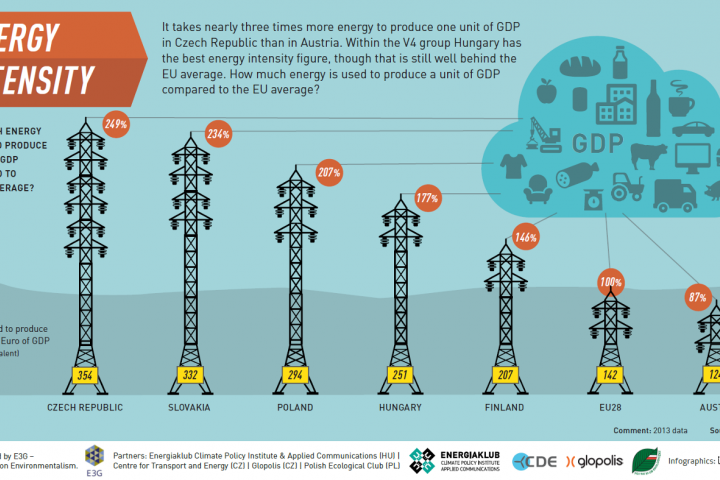
It takes nearly three times more energy to produce one unit of GDP in Czech Republic than in Austria. Within the V4 group Hungary has best energy intensity figure, though that is still well behind the...

Download
  • Continue
  • 1056 Budapest, Szerb u. 17-19.
  • +36 20 544-7100 (M-F: 9-18)
  • [email protected]

Lábléc

  • © ENERGIAKLUB - all rights reserved
  • terms of use
  • privacy policy