Visualized Data to Support Green Infrastructure Development
Urban green spaces—collectively referred to as green infrastructure—are not only effective tools for combating and adapting to the increasingly severe impacts of climate change (such as heatwaves, intense rainfall events, and drought), but they also play a key role in supporting public well-being and health. Therefore, it is in every local leader’s political interest to maintain and develop these areas. However, as resources are limited in most places, it is crucial to carefully select the areas prioritized for development.
In conscious, data-driven—so-called smart—cities, these decisions are not based on resident complaints or political pressure but on spatial data-based decision support tools, such as the GreenScape Visual Mapping Platform.
This tool also provided valuable support in the planning of pilot projects to be implemented by the participating urban areas. It offered data on key parameters, such as how many residents would directly benefit from a given development or to what extent the connectivity between green spaces would improve. A summary of all this can be found in the analysis available at the bottom of this article.
The analyses of the pilot cities provided concrete evidence of how important it is to consider accessibility, the green space index (GSI), multifunctionality, and connectivity. A few examples:
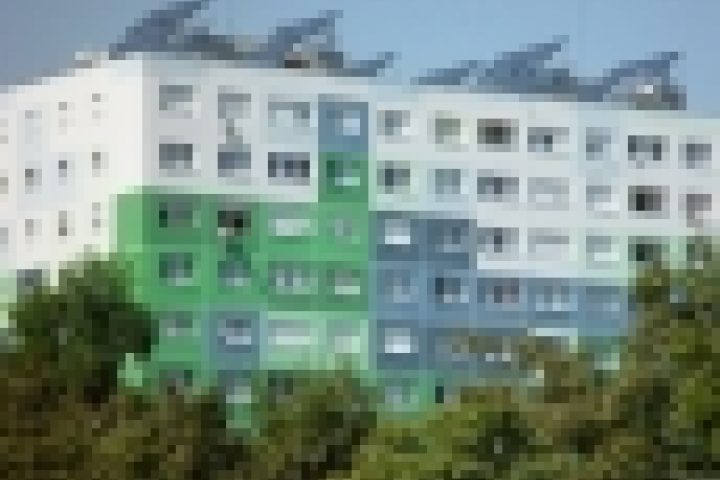
In Milan, green roofs were installed on social housing tower blocks, improving energy efficiency, reducing heat island effects, retaining rainwater, and involving residents in co-design processes that support urban agriculture and social interaction. The intervention increased the GSI by 44.88% and strengthened local connectivity within a 10–50 meter radius of existing green areas.
In Ptuj, the introduction of permeable pavements, rain gardens, and urban trees is expected to improve air and soil quality, biodiversity, and community well-being, while also ensuring social equity by involving elderly residents and schoolchildren. The GSI is set to increase by 46.47%. The municipality’s connectivity index will rise to 0.4030, indicating a relatively well-connected green space network.
In Zagreb, the transformation of degraded sports fields into multifunctional green spaces improved stormwater management, reduced the urban heat island effect, and restored biodiversity. Recreational and educational spaces were also created. Accessibility analysis showed that 12,836 residents live within 800 meters of the site. The initial GSI was 80.81%, and the connectivity indicators showed strong potential without barriers (0.9996), but also significant fragmentation caused by road networks (0.3126).
📥 The English-language study can be downloaded here (PDF format):
👉 Download: Using visual maps to determine possibilities for linking single GI/NbS actions in coherent networks
The project is supported by INTERREG CE Programme, co-funded by the European Union and Hungary. Official website of the project with outputs and event calendar is availabe here.